Australia
 New Zealand
 Singapore
 Hong Kong
 Malaysia
 Philippines
 Thailand
 Indonesia
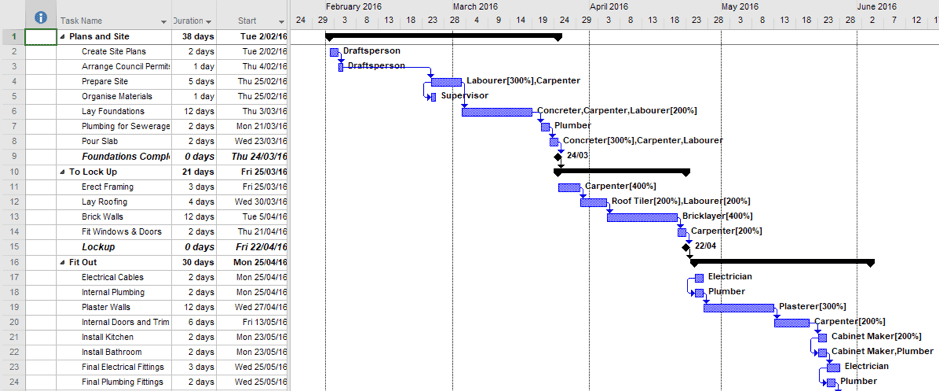
Tracking a series of related tasks against time is a process we perform often in both the workplace and in other aspects of our lives (such as that summer project - hint, hint - or to organise that next holiday if you are a detailed planner like I am). Having a project timeline that works for my pace is one of the ways people can oversee the entire project and take note of dependent tasks.
As humans, we relate better to graphical representations of data, like charts and pictures. Back in the early 20th century Henry Gantt, an engineer and consultant (although the term 'consultant' probably didn't exist back then) came up with a way to represent this, that we've all become very familiar with now. We are fortunate to be equipped with project management tools that can provide us with a visual representation of what needs to be prioritised within a specific project schedule.
The Gantt Chart
Project Managers live in these Gantt charts every day, with tools such as Microsoft Project providing detailed views and variations with ease (although a bit of training may be required to navigate a powerful tool like this). Managing projects involve a heavy workload and copious amounts of time spent on strategising and streamlining project tasks. This is especially true for a project manager who handles multiple teams at the same time.
For those of us without the need (or expense account) for full fledged PM tools, we can make use of the easier to reach options such as:
-
A 3rd party tool (web based tool or plug-in to an existing application)
-
An Excel Add-in
-
An Excel Template (someone has already done the hard work)
-
Do it yourself in Excel (you do the hard work by using an Excel worksheet)
There are more 3rd party Gantt Chart sites & tools than you can possibly count. You may find a great solution in one of these, although there might be a small learning curve and possibly a need to create an account. Some of the more basic Gantt Chart provide limited functionality unless a subscription is paid for (they have to earn a living somehow).
In a nutshell, a Gantt Chart shows a visual representation of tasks, timelines, dependencies, and project progress. Project managers are fond of the visual timeline feature of Gantt Charts to track progress, set task start dates, and assign tasks to their colleagues.
Through the organisation and visualisation of critical tasks at hand, managers can also streamline collaboration among its project teams and stakeholders with handy project schedules.

In Gantt charts, the horizontal axis represents the timeline of the project, with each task or activity plotted along the axis based on its start and end dates. The "Chart Design" tab in Gantt charts allows users to customize the appearance and formatting of the chart, such as selecting different color schemes, adding labels, adjusting gridlines, and applying various chart styles.
When creating a Gantt chart, it is often helpful to input sample data to get a visual representation of the project's timeline and dependencies before incorporating the actual project tasks and milestones.
Excel Add-ins are an underrated and lesser-known way of doing things in Excel that would otherwise be unachievable for us commoners. Add-ins can be simple macro-style helpers that perform tasks within the sheet, or more powerful interfaces in and out of external systems.

There are some Gantt Chart Add-ins but, similar to the 3rd party sites / tools, can have limitations or costs.
You don't need to create a Gantt Chart from scratch
The last resort is to do it yourself in Excel, with many well known Excel gurus blogging about how to do this in a small handful of steps based off a bar chart. This is great for having full control over the appearance, but may require some hard work beyond the basic look and feel.
Thankfully, Microsoft have provided a Gantt Chart template we can use in Excel. Launch Excel from your desktop and select New from the left navigation (or if already in Excel, click the File ribbon tab to go backstage then select New).
In the "Search for Online Templates" box type Gantt and press <Enter>.
There are a variety of chart types, for this exercise we'll select the Simple Gantt Chart. Click on this (or your preferred one) and select the Create button when the description box appears.

The template is pre-populated with mocked-up data and begins today. For this template there is an "About" worksheet with instructions and links to further help. Also on the "ProjectSchedule" sheet is a series of help comments in column A - you'll see them in the formula bar.

Depending on when you create the new file, you may notice the date format is US mm/dd/yy. This is one of the constant battles between the US and UK date formats, and depends on the cell number formatting.

We recommend the very first thing you do is modify this. Otherwise confusion is sure to occur, as you will need to input dates in the system locale (say UK format) but it will display per the number format of the cell.
For the Project Start Date:
-
Select cells E3 to F3 (it's a merged cell so click on E3 or F3 only)
-
Right click and choose "Format Cells..."
-
In the Type field change the order of 'm' and 'd' so it becomes: "ddd, d/m/yyyy"

For all the dates in the Gantt Chart:
-
Select from cell E8 to F33 (assuming you've made no changes to rows / columns yet)
-
Right click and choose "Format Cells..."
-
You can select any of the other display formats, or just modify the Locale (location) field to be English (Australia) or your appropriate locale

A good practice is to choose a date display that is preceded with asterisk (*). So, it adjusts per the user's locale on their PC.
Then you can modify the chart contents using data entry. Even formulas if you want to link dates or use arithmetic to determine end dates based on duration.
Not every template is perfect so you should try a few to find the one that best fits your needs. Some create a separate chart object while others represent the timeline in a table using conditional formatting (like this one) in Gantt Charts.
And there are limitations in the layout (8 weeks on display horizontally). Which would need manipulation of the sheet to extend further.
Gantt Charts in Excel (Excel Gantt Chart template) won't usually feature the rich project management functionality. Of task dependencies, linked start / end dates (although you can do this with formulas) or resource allocation.
Get a Better Grip of Your Projects with Gantt Charts
Learning the art of using Gantt charts is immensely valuable for project teams as it offers a powerful tool for managing tasks, dates, and visualizing project progress. Gantt charts provide a clear and intuitive visual representation of the project timeline, allowing team members to easily grasp the order of tasks and their respective dates. By incorporating task dates into a Gantt Chart, project teams can effectively track deadlines, identify critical paths, and manage dependencies. This visual representation enables better communication and collaboration within the team, ensuring everyone is aligned and aware of project milestones and deadlines. With Gantt Charts, project teams can easily identify bottlenecks, allocate resources efficiently, and make informed decisions to keep the project on track. Ultimately, mastering the use of Gantt Charts empowers project teams to effectively plan, organise, and execute projects, leading to improved productivity, timely delivery, and successful project outcomes.
If you'd like to learn more about formatting cells, using dates in formulas, condition formatting or creating charts in Microsoft Excel, book a seat in one of our Excel courses. Our trainers are dedicated to share their knowledge on creating a well-optimised and effective Gantt chart for project timelines.
You will start with learning the basic functions of an Excel spreadsheet including Gantt Charts through our Beginner course all the way to the more advanced features through our Intermediate, Advanced, and Expert courses leading to your most-awaited Certification.