Australia
 New Zealand
 Singapore
 Hong Kong
 Malaysia
 Philippines
 Thailand
 Indonesia
While you may or may not have the title of Project Manager, in effect many of us are managing various projects on a daily basis in the workplace. If you find yourself struggling to stay on top of the detail and keep it all on track, then Microsoft Project is the go-to application to use.
It allows you to easily manage resources and budgets in one place. Build Gannt charts, track progress, analyse workloads and view progress reports. Effective use of MS Project will go a long way to helping put some order on your workload.
We have put a quick guide together to help you get the most out of Project. Whether you are new to the application or have been using it for a while, check out the tips and make sure you have them in your toolkit.
Setting Options
As the first step to creating a new project plan set your parameters according to your specific workplace requirements, such as hours per day/week. Configuring these options will allow you to keep track of the project’s progress from start to finish, according to your organisation’s specific requirements
Custom Calendars
You can create custom calendars that are applied to the Project overall, a Specific Task or a Specific resource.
Use Views
Make use of the many views within Project to oversee the tasks and resources based on your convenience. Use the View ribbon, turn-split view on or off and quickly change views by right click on the view bar. This appears as a thin panel on the left side of the screen with the view name).
 Figure 3: Gannt Chart View
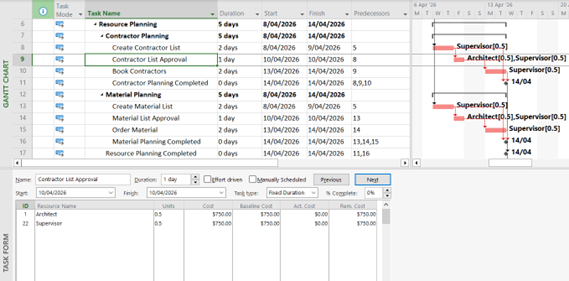
Figure 4: Split Screen (Detail) View
Modify Views
Modify any view by adding - or hiding - columns so you see the data you need. Focus on the key information, and don't get distracted by extraneous detail. You can do this by clicking the Resource Views or Task Views group, and selecting the view you prefer. If none of the views is to your liking, you can also click Gantt Chart, Calendar View, Network Diagram View, Timeline View, and More Views on the Task Views panel.
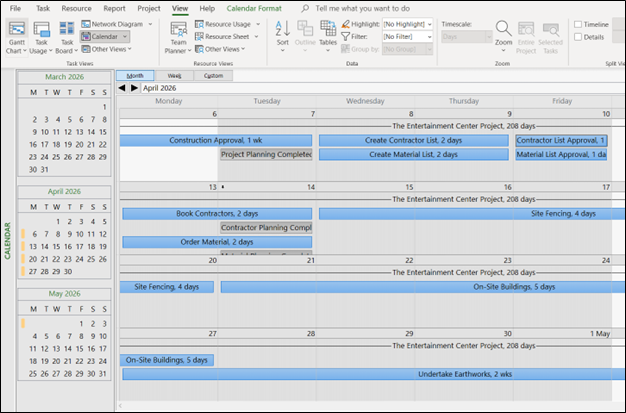 Figure 5: Calendar View
Use Baselines
Establish a baseline (or several) as the project progresses, so you can measure variance as the plan and achievements change. This will help you identify and communicate any variations early. To start setting baselines, go to Schedule, and then look for the Quick Launch button. You will see the Task tab, then the Editing Group, where you can click Set Baseline. From there, you can select the baseline you want to use.
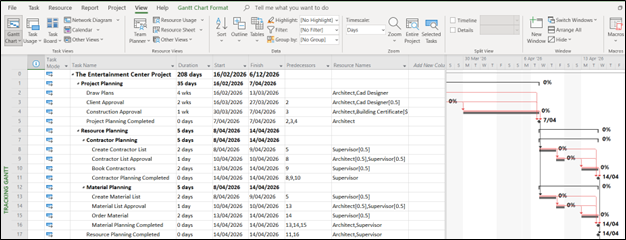 Figure 6: Tracking Gannt showing Baseline
Auto-Schedule
Turn on Auto Schedule before creating tasks so Project can calculate the schedule. This can also be toggled on for All New Projects in the Options and Schedule, so you don't have to reselect each time. This feature comes in handy for structuring and planning out projects with long lists of tasks you never have to manually schedule again.
Display Resource Information
Dealing with multiple tasks, assignments, and resources will be more effortless when you can display them simultaneously on one screen. You can check all the information by using the Shift + F2 combination to get the full details of the project through a detailed pop-up box.
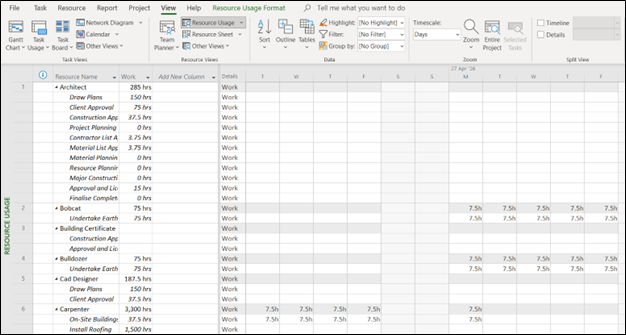 Figure 7: Resource Usage view
Build a Work Breakdown Structure
To use a WBS, you create the breakdown of your project into smaller manageable pieces and end up with a diagram such as the one below. The WBS technique allows you to break the project down until you can identify for any one task what is required to accomplish that task (time, resources, cost, etc.).
You can then use this diagram to create the project plan.
Project also has an option in the Gannt Chart to display the Outline numbering (essentially a WBS) or to display the customizable WBS column.
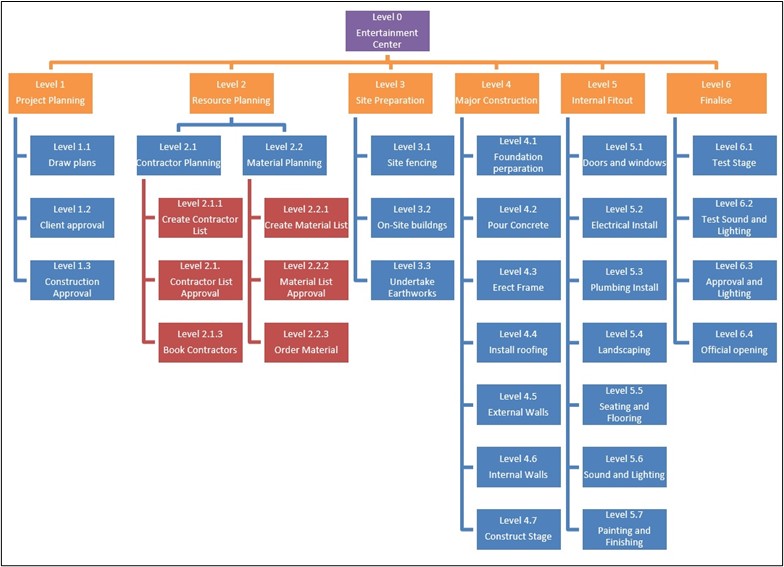 Figure 8: Work Breakdown Structure
Sort Using the Auto-Filter Dropdown Menu
Your page can look cluttered and overwhelming when you have hundreds of rows within a single column. Sorting them manually is not an option since this can be extremely time-consuming. By using the auto-filter dropdown menu, you can organize your rows and data without spending a considerable amount of time on it. Simply use the shortcut Alt +Shift +F3.
 Figure 9: Sort or filter by date

Figure 10: Sort or Filter by resources
Utilize Time-Scale
You can view the entire timeline of a project on Team Planner Mode. But you’ll have to drag your mouse cursor constantly if you want to view a whole year’s worth of projects. By using the time-scale feature through the Alt + Left Arrow or Alt + Right Arrow shortcut, you can scroll through the projects horizontally without much effort.
There is also a scroll-to-task option on the Ribbon (Ctrl+Shift+F5) that will line the timescale up with the current task.
Activate Overtype Mode
Typing over any task is made easier by activating the overtype mode. You may use Cmd + Shift + L on Mac, and Ctrl + Shift + L on Linux and Windows.
Work With Ribbon
Typing away is easier and more ergonomic than using a mouse to complete all your tasks. By pressing the keys Shift + F10, you can execute all kinds of commands using solely your keyboard. Each command has a key assigned to it, and you can press Tab to move through these commands. Use Alt to select an option and press it again to exit the view.
Work with the Quick Access Toolbar (QAT)
You can customize the QAT and add in any of the commands in Project that you commonly use. This allows you to configure the Project interface to work the way you want it to, not the other way around. Some of the common commands that are added to the QAT are Close File, Project Statistics and Scroll to Task.
The one below has been customized to give quick access to the following commands:
New, Open, Save, Undo, Redo, Print Preview, Project Statistics, Scroll to Task
 Figure 11: QAT - Customised
Use Auto-Calculate
Dealing with figures does not have to be tedious. MS Project offers a feature that allows you to switch between your cells’ default calculability. You can easily turn the auto-calculator mode on or off by using the shortcut Ctrl + F9.
Make a Global Template
If most of your projects consist of similar custom pools, resource elements, and settings, you can create a global template for your succeeding projects. You do not have to rework a project’s filters, fields, calendars, or custom tables with this feature.
First, open your new schedule and old schedule with the desired metrics simultaneously. Next, go to the File tab, then the Info option under the new schedule. Here, you will see the button ‘Organize Global Template.’ Select the category and reporting metrics you want to copy from the old schedule.
 Figure 12: Project Organiser
Custom Fields
One option a lot of users are not aware of is the option to use Custom Fields. There are over 100 fields that can be customized to record data for a task or resource that is not included in the standard views. Custom data can include items such as Hazardous Material (yes/No) or custom text fields (list of Hazardous Material), certifications of specific resources (hazardous material training, etc).
Take Your MS Project Management to the Next Level
These are just some of the MS Project hacks to further your productivity and get your project going on a smooth path. MS Project offers boundless possibilities in terms of project management and other purposes it can serve your organization.
Want to learn how to use Microsoft Project effectively? Take a look at our range of courses, catering for all users, from Beginner to Advanced.