Select your country to view prices and course dates.

x

Recent Searches
Category

Microsoft Copilot Courses

Category

Microsoft Power BI

Category

AI for Business

Category

Microsoft Excel

Category

Professional Development

Category

Microsoft Office 365

Category

Excel Specialist

Category

Microsoft Project

Category

R Programming

Category

Python

Category

SQL

Category

Power Apps

Category

SharePoint

Category

Power Automate

Category

Microsoft Teams

Category

Microsoft Visio

Category

Microsoft PowerPoint

Category

Microsoft Word

Category

Microsoft Outlook

Category

Adobe InDesign Courses

Category

Adobe Photoshop Courses

Category

Adobe Illustrator Courses

Category

Adobe Premiere Pro Training

Category

Adobe After Effects Training

Category

Adobe Acrobat Courses

Category

Adobe Captivate Training

Category

Adobe Animate Training

Category

HTML Courses

Category

WordPress

Category

Canva Courses

Category

Microsoft Access

Category

Webinars

Course

Copilot for M365

Course

Power BI Beginner

Course

ChatGPT Beginner

Course

Excel Beginner

Course

Achieving Leadership & Success

Course

Microsoft 365 Beginner

Course

Financial Modelling

Course

Project Beginner

Course

R Programming Beginner

Course

Python Beginner

Course

SQL Beginner

Course

Power Apps Beginner

Course

SharePoint Beginner

Course

Teams Essentials

Course

Visio Essentials

Course

PowerPoint Level 1

Course

Word Beginner

Course

Microsoft Outlook Beginner

Course

InDesign Lite

Course

Photoshop Training Intro

Course

Illustrator Training Intro

Course

Premiere Training Intro

Course

After Effects Training Intro

Course

Acrobat Essentials

Course

Captivate Training

Course

Animate Training Intro

Course

HTML Training Intro

Course

WordPress Essentials

Course

Canva Beginners

Course

Microsoft Access Essentials

Course

Copilot for Word

Course

Power BI Intermediate

Course

Excel Intermediate

Course

Microsoft 365 Intermediate

Course

Analysis and Dashboards

Course

Project Intermediate

Course

R Programming Intermediate

Course

Python Intermediate

Course

SQL Intermediate

Course

Power Apps Intermediate

Course

SharePoint Intermediate

Course

PowerPoint Level 2

Course

Word Intermediate

Course

InDesign Training Intro

Course

Photoshop Lite

Course

Illustrator Training Advanced

Course

Premiere Basics Training

Course

Acrobat Forms

Course

Canva Intermediate

Course

Microsoft Access Advanced

Course

Copilot for Excel

Course

Power BI Advanced

Course

Excel Advanced

Course

Microsoft 365 Advanced

Course

Excel VBA

Course

Project Advanced

Course

R Programming Advanced

Course

Python Advanced

Course

SQL Advanced

Course

Power Apps Advanced

Course

SharePoint Advanced (Site Owner)

Course

Word Advanced

Course

InDesign Training Advanced

Course

Photoshop Training Advanced

Course

Advanced Premiere Training

Course

Advanced After Effects Training

Course

Canva Advanced

Course

Copilot for PowerPoint

Course

Power BI DAX

Course

Excel Expert

Course

Machine Learning in R

Course

SharePoint Advanced (Document Governance)

Course

InDesign Interactivity Training

Course

Copilot for Outlook and Teams

Course

InDesign Accessibility Training

Course

Power Automate Beginner

Course

Power Automate Intermediate

Course

Microsoft Outlook Advanced

Course

AI Prompting Fundamentals

Course

Power Automate Advanced

Course

Excel Tables and Pivot Tables

Course

Data Transformation with Power Query

Course

Excel Macro Mastery

Course

Power BI Desktop Advanced Reporting

Course

AI for Business Leaders and Managers

Course

Data Visualisation with Power BI Desktop

Course

Anger Management & Negotiation Skills

Course

Assertiveness & Confidence

Course

Building Resilience

Course

Coaching and Mentoring

Course

Communications

Course

Communications & Quality Client Service Training

Course

Critical Thinking and Problem Solving

Course

Cultural Diversity in the Workplace

Course

Embracing Change

Course

Growing Emotional Intelligence

Course

Minute Taking

Course

Persuasion and Negotiation Skills

Course

Presentation Skills and Public Speaking

Course

Practical Project Management

Course

Respect, Equity and Diversity (RED)

Course

Resumé Writing and Interview Skills

Course

Stress Management

Course

Team Leadership, Management and Development

Course

Time Management Intensive

Course

Train the Trainer

Course

Write Effective Business Documents

Course

Dealing with Difficult People

Course

Managing Difficult Conversations

Course

Managing the Virtual Workplace

Janitor Package in R | Cleaning Data

Tamara Shatar | Jul 30, 2021
Binary code header

The Janitor Package in R for Cleaning and Examining Data


As a trainer, my role is to show my students better ways of working. If I am successful, they leave my class with the skills to get things done faster, more accurately and with less time spent on boring, repetitive tasks. And as someone who works with data, I am always looking for tools that will make my life easier. Working with the R programming language, there are always new discoveries to be made amongst the nearly 18,000 packages created by the user community.

My latest discovery is the package janitor. It contains easy-to-use and convenient functions for cleaning and examining data. Let's take a look at some of these functions.

1. clean_names()


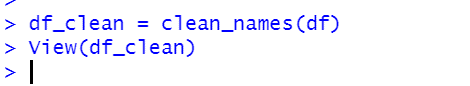
This function is used to change and clean up names of columns in data frames. It can be used to ensure consistency. You can choose to change all names to snake case (all lower case words, separated by underscores), variations on camel case (internal capital letters between words), title case or other styles. It can also be used to remove parts of names and any special characters, including replacing % symbols with the word percent.

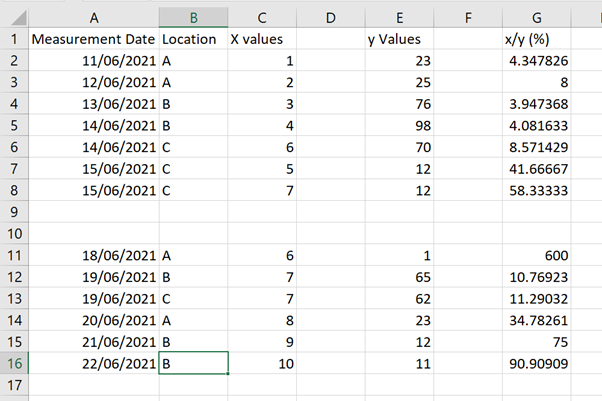
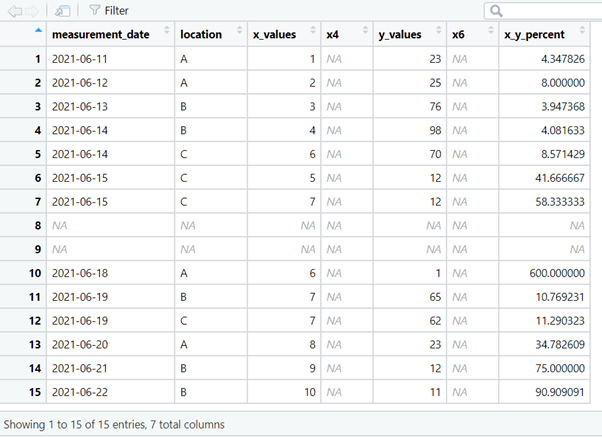
To demonstrate functionality from the janitor package, a dataset was created in Excel.

 janitor image 1
 janitor  image 1


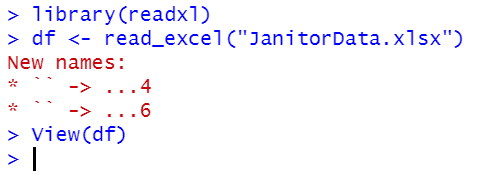
The data were imported into a data frame (df) using the RStudio GUI From Excel… option.

janitor  image 1


janitor  image 1


janitor  image 1


janitor  image 1


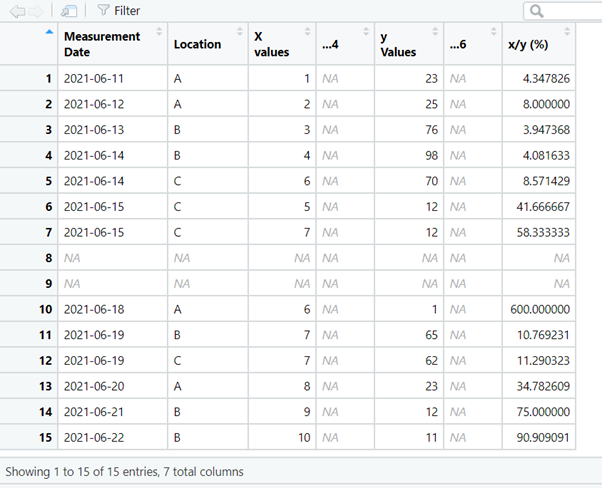
Using the clean_names() function adds consistency to the names, removes spaces in the names and special characters.
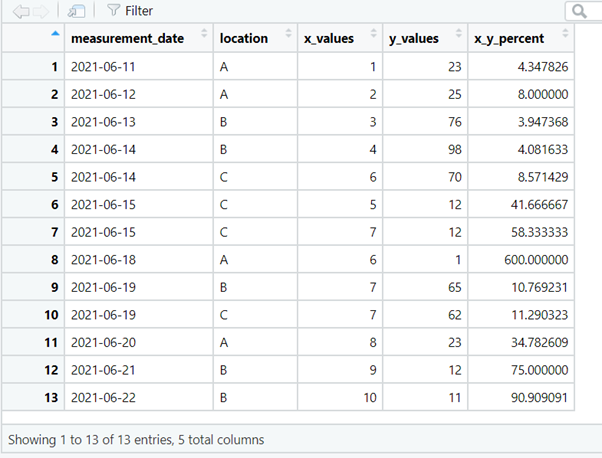
janitor  image 1


janitor  image 1


janitor  image 1


janitor  image 1


2. remove_empty()

The dataset contains empty rows and empty columns that can be removed with the remove_empty() function.
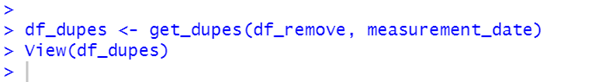
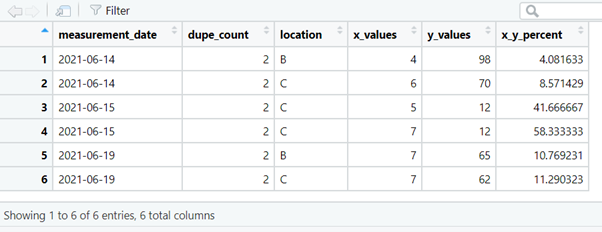
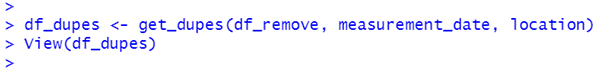
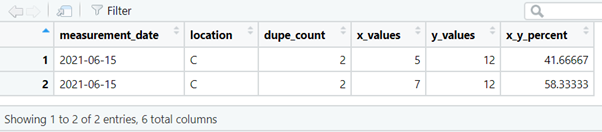
janitor  image 1


janitor  image 1


janitor  image 1


janitor  image 1


3. get_dupes()

This function retrieves any duplicates in the dataset so that they can be examined during data clean-up operations. The first argument accepts the name of the data frame, the second and subsequent arguments accept one or more column names. These columns are searched for duplicate values. The function returns a data frame which includes a dupe_count column containing the number of duplicates of that value.

We can search for duplicated measurements on certain dates,

janitor  image 1


janitor  image 1


janitor  image 1


janitor  image 1


or for duplicated measurements on certain dates, at certain locations.
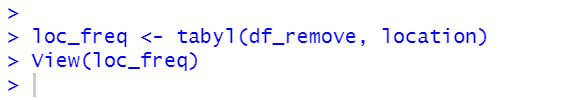
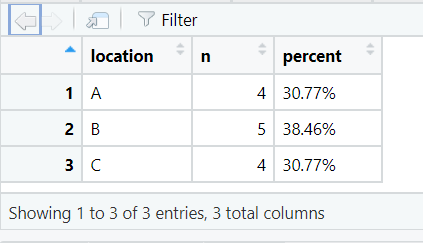
janitor  image 1


janitor  image 1


janitor  image 1


janitor  image 1


4. tabyl()


This function is used to produce frequency tables and contingency tables, i.e. counts of each category or combination of categories of data. Unlike the base R table() function, tabyl() returns a data frame which makes results easier to work with.

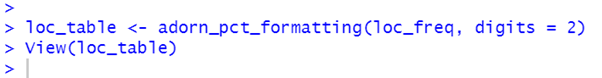
The code below creates a data frame showing the number of rows of data (n) for each location in the dataset. Also returned is a percent column, showing the percentage of rows containing data for that location.
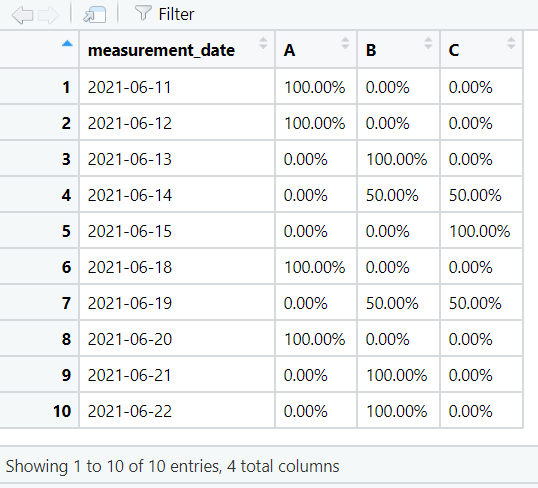
janitor  image 1


janitor  image 1


janitor  image 1


janitor  image 1


5. adorn_

Janitor also provides adorn_ functions for formatting tabulated data. adorn_pct_formatting() can be used to format the percentage output.


janitor  image 1


janitor  image 1


janitor  image 1


janitor  image 1


We can also return the number of observations for each location on each date.

janitor  image 1


janitor  image 1


janitor  image 1


janitor  image 1


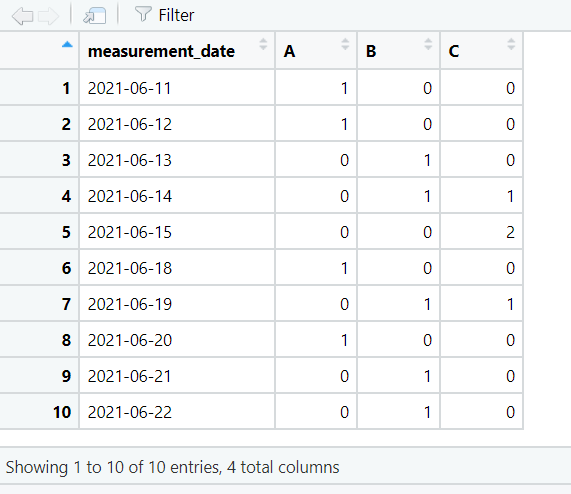
By default the values in the contingency table are shown as counts. They can be changed to percentages using adorn_percentages().

janitor  image 1


janitor  image 1


janitor  image 1


janitor  image 1


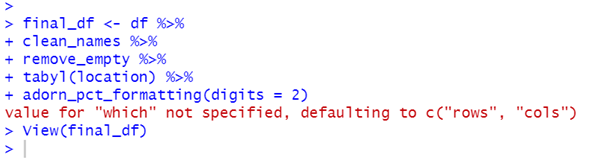
Use janitor functions with tidyverse pipes

If you use tidyverse pipes, you can use janitor functions in your pipelines to streamline data frame clean-up.

janitor  image 1


janitor  image 1


janitor  image 1


janitor  image 1


Learn more about janitor at the CRAN site.

If you're new to R, check out our R training course and certifications.

Trusted Globally by Leading Organisations

At Nexacu, we are proud to be the trusted training partner for hundreds of leading organisations across Australia, New Zealand, and around the world. From government agencies to multinational corporations, we help teams build practical skills and achieve real outcomes through expert-led training.

  • 400+ companies rely on Nexacu for workforce development
  • Trusted by government agencies at all levels
  • Delivering training across 9 countries and growing

Why Nexacu? 

step by step courseware

Step by Step Courseware

Custom workbook included with a step by step exercises

Facility Image 2
Facility Image 3
Facility Image 1

Interactive real time training

Interactive, Real-Time Training

Learn with expert instructors, wherever you are

Trusted by Business

Trusted by Business

Procured by Government

Procured by Goverment

Reviews Not Found

Valued by Individuals