How to Clean Messy Data in Excel Using Power Query (Step-by-Step)
Messy Excel data is one of the great workplace constants. Exports arrive with blank rows, merged headings, inconsistent dates, odd spacing, duplicated records, broken names, and columns that somehow contain both numbers and text despite the laws of reason.
The usual response is to start hacking away manually. Delete a few rows. Insert a few formulas. Copy, paste, trim, split, sort, filter, hope for the best. It works, until the next file arrives and you have to do it all again.
This is exactly where Power Query earns its keep. It gives Excel users a repeatable way to import, clean, reshape, and standardise messy data without relying on fragile manual steps. Instead of rebuilding your clean-up every week, you create a process once, then refresh it when new data lands.
TL;DR: Power Query is one of the best tools in Excel for cleaning messy data. Import the file, remove junk rows, promote headers, split combined fields, replace inconsistent values, fix data types, and load the result back into Excel.
The big win is repeatability. Once you build the clean-up steps, you can refresh the query on the next export instead of starting from scratch like a spreadsheet time traveller trapped in a loop.
1) Why use Power Query to clean Excel data?
Power Query is built for data preparation. In everyday terms, that means it helps you take a messy file and turn it into something usable before you start analysing, charting, reporting, or building dashboards.
The biggest advantage is that Power Query records your clean-up steps. Instead of manually trimming text, deleting unwanted rows, fixing formats, and splitting columns every time a file lands in your inbox, you do the clean-up once and save the process as a query. When the next export arrives, you refresh it.
That makes Power Query especially valuable for recurring reports, monthly exports, CRM extracts, finance files, contact lists, inventory data, survey results, and anything else that arrives in a familiar but irritating state.

Practical benefit: formulas are great for calculations, but Power Query is often better for preparation. It helps you fix the shape and quality of the data before you start analysing it.
- It reduces repetitive manual clean-up
- It creates repeatable steps
- It keeps raw data separate from cleaned data
- It supports larger and messier files more safely
- It integrates neatly with Excel reporting workflows
- Business judgement about which records matter
- Clear naming conventions and data ownership
- Good source system design
- Quality checks before reporting
- Common sense, sadly still required
2) What kinds of messy data can Power Query fix?
A lot, frankly. If your dataset looks like it was exported by a helpful robot with chaotic handwriting, Power Query can usually tame it.
Typical problems include blank rows at the top of a file, repeated headings, inconsistent date formats, text with leading or trailing spaces, values combined in one column, extra columns you do not need, duplicate records, and labels that refer to the same thing but are written differently.
3) Step-by-step: how to clean messy data in Excel using Power Query
Below is a practical workflow you can follow for most everyday clean-up jobs. You will not need every step every time, but this gives you a solid pattern.

In Excel, go to Data > Get & Transform Data. Depending on where the data lives, choose the appropriate option, such as From Table/Range, From Text/CSV, or another source.
If the data is already in your worksheet, convert it to a table first if needed, then open it in Power Query. Keeping the source as a table makes refreshes much cleaner later on.
Many exports begin with junk, titles, report dates, blank rows, or repeated headers. Use Home > Remove Rows to remove top rows, bottom rows, or blank rows.
This is one of the first clean-up steps because it gets the file into a shape where the real headers and values can be recognised properly.
Once the junk rows are gone, use Use First Row as Headers. This turns the correct row into the column names for your dataset.
This matters because many later steps depend on clean column names. If your headers are still wrong, everything that follows becomes harder than it needs to be.
Delete columns you do not need. This keeps the query cleaner and reduces the chance of stray fields causing confusion later.
A good rule is to keep only the columns that support the reporting or analysis you actually need. There is no medal for carrying useless baggage through a query.
If one column contains multiple values, such as full name, suburb and state, or product code and description, use Split Column. You can split by delimiter, fixed number of characters, or other options.
This is one of the most useful Power Query tools because messy exports often cram too much into a single field. Splitting columns early makes filtering, grouping, and analysis much easier later.
Use Replace Values to standardise labels. This is handy when the same thing appears in different forms, such as NSW and New South Wales, Yes and Y, or blank and N/A.
Standardising values makes downstream pivot tables, charts, and summaries much more reliable. Otherwise, your report may happily treat one thing as three different categories.
Text fields often include extra spaces or non-printing characters. Use Transform > Format > Trim and Clean to tidy them up.
This step is easy to overlook, but it solves a surprising number of issues, especially when lookups or joins fail because one value has an invisible extra space hiding in it like a tiny gremlin.
Check each column’s data type. Dates should be dates, numbers should be numbers, and IDs that look numeric but are really text should stay as text if leading zeroes matter.
This step matters enormously. If data types are wrong, calculations, sorting, and visuals can all behave badly. Power Query makes it easy to set the correct type before the data reaches the worksheet.
Select the relevant columns and use Remove Duplicates if duplicate rows should not exist. You can also filter columns to identify blanks, nulls, or suspicious values.
This is where a little business logic comes in. Not every repeated record is a mistake. Remove duplicates only when you are sure the rows truly represent the same item.
When the data looks right, choose Close & Load to bring the cleaned result back into Excel. You can load it as a table, a connection, or into the data model depending on your reporting needs.
Now, when the next file arrives, update the source and refresh the query. That is where Power Query stops being a neat feature and starts becoming a proper workflow improvement.
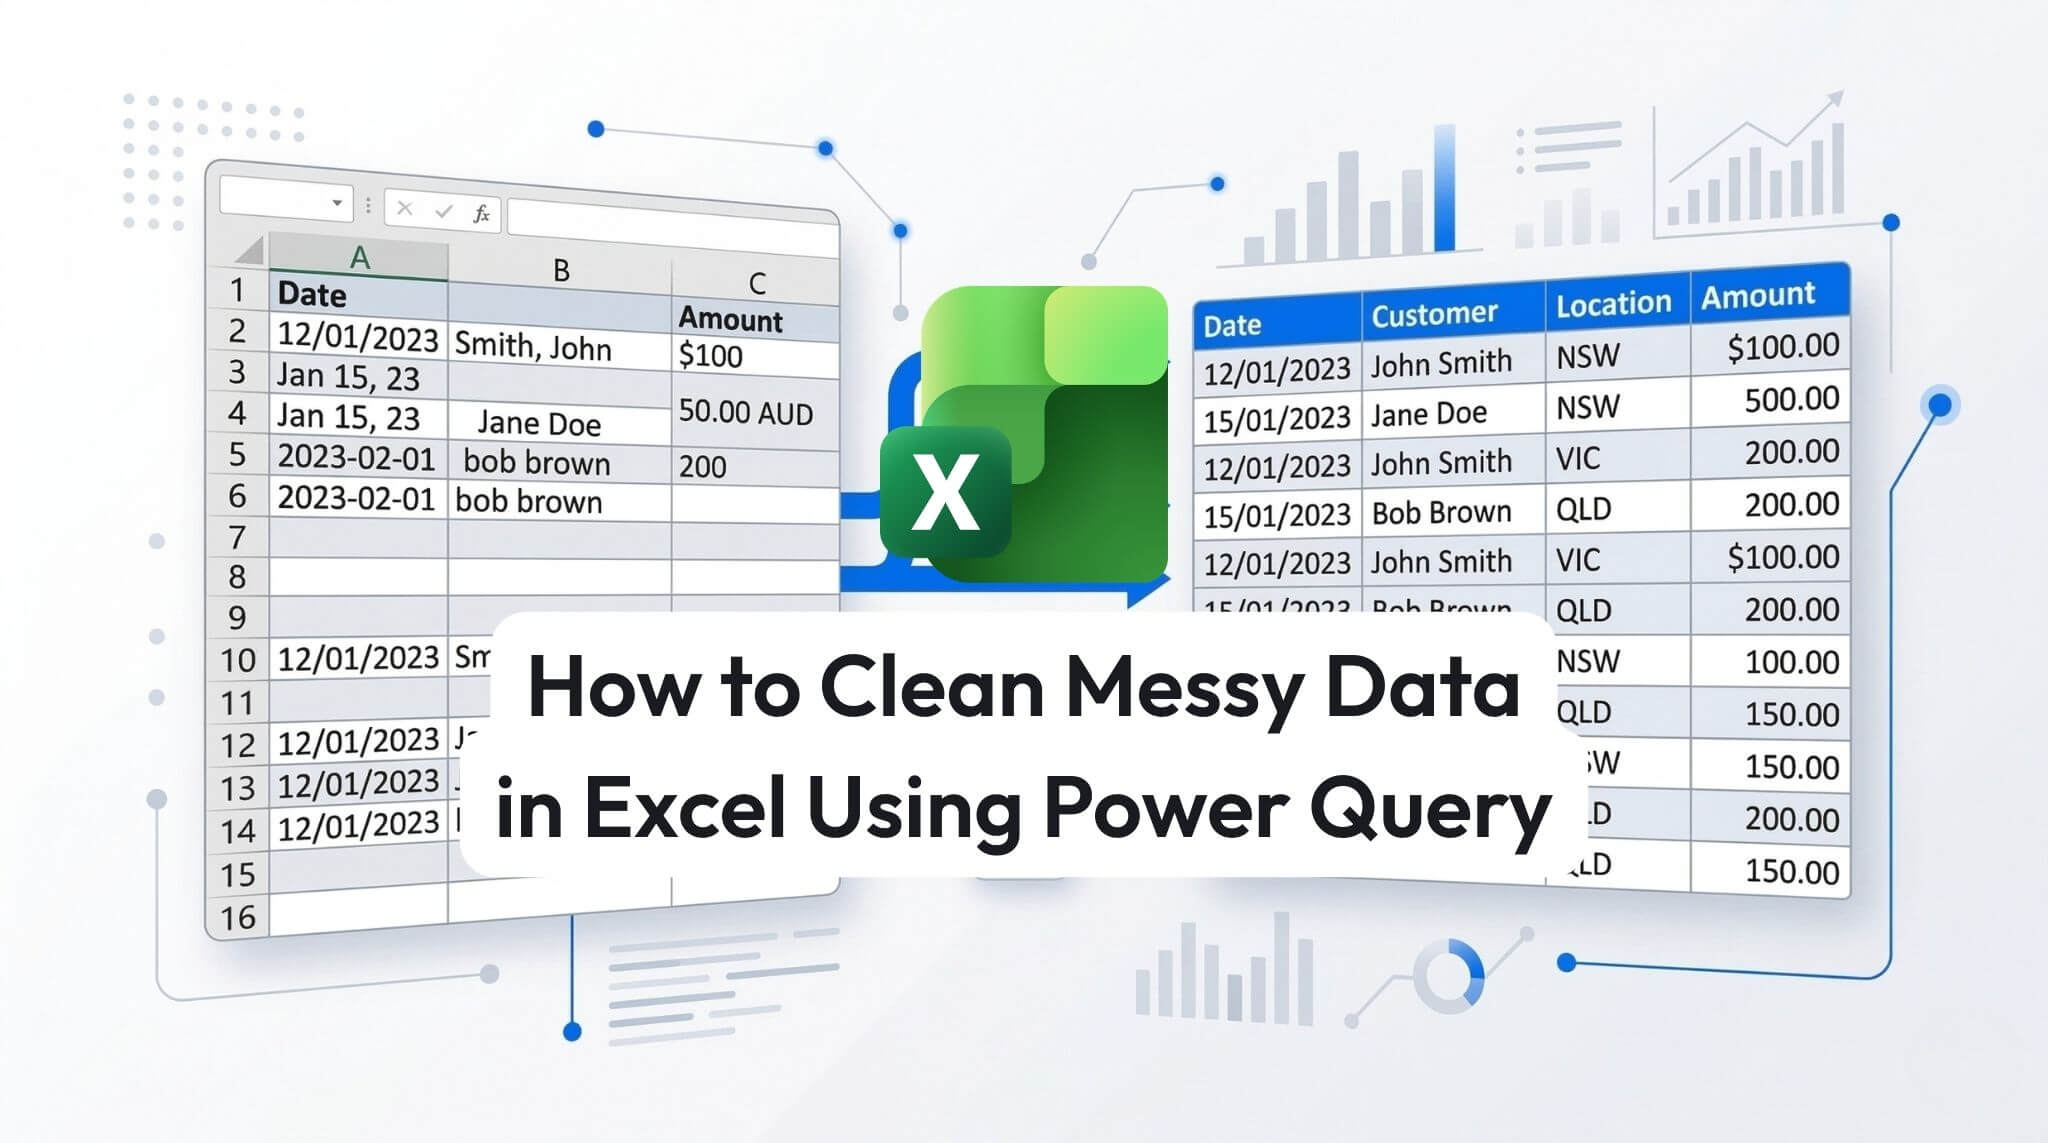
4) Real-world example: cleaning a monthly sales export
Imagine you receive a monthly sales export from another system. The file starts with a report title and date. The real headers are on row four. Customer full name is in one column. Location contains suburb, state, and postcode all jammed together. Revenue is stored as text. There are a few blank lines and duplicate customer records.
A manual clean-up might take fifteen or twenty minutes each month, plus extra time if the file layout shifts slightly. In Power Query, the workflow would look something like this:
- Import the file from the source into Power Query.
- Remove top rows so the actual header row is exposed.
- Promote headers so each field has the correct column name.
- Remove blank rows and any columns not needed for reporting.
- Split full name into first name and surname if required.
- Split location by delimiter so suburb, state, and postcode become separate fields.
- Change revenue from text to decimal number.
- Trim text fields so categories and customer names are consistent.
- Remove duplicates based on the correct business rule.
- Load the result into Excel for pivot tables, charts, or a dashboard.
The beauty of this approach is not only that the current file gets cleaned. It is that next month’s file gets cleaned too, with a refresh. That is the difference between busy work and process design.

5) Quick fixes for common Power Query clean-up problems
Power Query is powerful, but a few small mistakes can make the results look odd. Here are the common ones and the fix for each.
Remove the extra top rows first, then use Use First Row as Headers. Do not promote the wrong row and hope reality adjusts itself.
Check the data type. If the column is still text, Power Query will not treat it like a real date.
Review which columns define a true duplicate. Removing duplicates on the wrong field can remove good data or miss the real repeats.
Make sure the delimiter is correct. A comma, slash, dash, or fixed number of characters can produce very different results.
Small but important tip: rename your query steps if the process gets longer. “Filtered Rows” and “Changed Type” repeated twelve times is a marvellous way to confuse future-you.
6) When should you use Power Query instead of formulas?
Use Power Query when the job is mainly about cleaning, reshaping, importing, or standardising data. Use formulas when the job is mainly about calculating or deriving values inside the worksheet.
That is not a rigid rule, but it is a good starting point. If you keep importing recurring files and applying the same manual fixes, Power Query is usually the better answer. If you need to calculate margin, categorise values with logic, or build dynamic spreadsheet outputs, formulas may still be the right tool.
In practice, strong Excel users often use both together. Power Query cleans the source data, then formulas, pivot tables, charts, or dashboards do the analysis. That is where Excel becomes much more than a glorified digital notepad with gridlines.
For teams ready to go further with Power Query, advanced Excel analysis, and cleaner reporting workflows, Nexacu offers practical training in Excel Expert and Analysis & Dashboards.
7) FAQs (expand to read)
These are some of the questions Excel users ask when they first start using Power Query for data clean-up.
Is Power Query better than cleaning data manually in Excel?
Usually, yes, especially for recurring files. Manual clean-up can work for one-off jobs, but Power Query is much better when you need repeatable, refreshable steps.
Can Power Query handle CSV files?
Yes. CSV files are one of the most common uses for Power Query. It is very useful for imports from other systems, reports, and recurring exports.
Will Power Query change my original data?
No, not by default. Power Query works on the imported data and creates a transformed result. This helps keep your raw source data separate from the cleaned output.
Do I need Excel formulas as well?
Often, yes. Power Query is ideal for preparing data. Formulas are still useful for calculations and worksheet-based logic after the data has been cleaned.
Is Power Query worth learning for business users?
Absolutely. If you regularly clean or combine exported data in Excel, Power Query can save a lot of time and make your process more consistent and less error-prone.
8) The bottom line
If you are still cleaning recurring Excel files by hand, Power Query is one of the best upgrades you can make to your workflow. It gives you a structured, repeatable way to import messy data, remove clutter, fix fields, standardise values, and refresh the result when new data arrives.
That does not just save time. It also reduces error, improves consistency, and makes analysis downstream much easier. Whether you are building monthly reports, dashboards, operational summaries, or finance packs, better source data usually means better decisions.
In short, Power Query helps Excel users spend less time scrubbing data and more time using it. Which, in the weird and wonderful world of spreadsheets, is about as close as one gets to civilisation.
Build stronger Excel analysis skills with practical, instructor-led training
Whether you want to master advanced Excel features or improve your reporting with cleaner data, dashboards, and better workflows, Nexacu offers hands-on training to help teams use Excel more effectively.
- Pivot tables and data summaries
Turn cleaned data into useful reports quickly
- Charts and dashboards
Present insights clearly for decision makers
- Advanced Excel functions
Support deeper analysis after the data is prepared
Note: Power Query steps can vary slightly depending on your version of Excel and the source type. For recurring reports, it is worth testing the query with a second file to make sure the steps refresh cleanly.