Recent Searches
Category

Microsoft Power BI

Category

Microsoft Copilot Courses

Category

AI for Business

Category

Microsoft Windows 11 Courses

Category

Microsoft 365

Category

Microsoft Excel

Category

Excel Specialist

Category

Microsoft Project

Category

R Programming

Category

Python

Category

Power Apps

Category

SQL

Category

SharePoint

Category

Microsoft Teams

Category

Power Automate

Category

Microsoft Visio

Category

Microsoft PowerPoint

Category

Microsoft Word

Category

Microsoft Outlook

Category

Adobe InDesign Courses

Category

Adobe Photoshop Courses

Category

Adobe Illustrator Courses

Category

Adobe Premiere Pro Training

Category

Adobe After Effects Training

Category

Adobe Acrobat Courses

Category

Adobe Captivate Training

Category

Adobe Animate Training

Category

Canva Courses

Category

HTML Courses

Category

WordPress

Category

Professional Development

Category

Microsoft Access

Category

Webinars Old

Course

Power BI Beginner

Course

Copilot for M365

Course

Windows 11 End User Course

Course

Excel Beginner

Course

Financial Modelling

Course

Project Beginner

Course

R Programming Beginner

Course

Python Beginner

Course

Power Apps Beginner

Course

SQL Beginner

Course

SharePoint Beginner

Course

Teams Essentials

Course

Visio Essentials

Course

PowerPoint Level 1

Course

Word Intermediate

Course

Word Beginner

Course

Word Advanced

Course

Microsoft Outlook Beginner to Intermediate

Course

InDesign Lite

Course

Photoshop Lite

Course

Illustrator Training Intro

Course

Premiere Training Intro

Course

After Effects Training Intro

Course

Acrobat Essentials

Course

Captivate Training

Course

Animate Training Intro

Course

Canva AI

Course

HTML Training Intro

Course

Achieving Leadership & Success

Course

Microsoft Access Essentials

Course

Copilot for M365 On Demand

Course

Power BI Intermediate

Course

Copilot for Word

Course

ChatGPT Beginner

Course

Microsoft 365 Beginner

Course

Excel Intermediate

Course

Analysis and Dashboards

Course

Project Intermediate

Course

R Programming Intermediate

Course

Python Intermediate

Course

Power Apps Intermediate

Course

SQL Intermediate

Course

SharePoint Intermediate

Course

PowerPoint Level 2

Course

InDesign Training Intro

Course

Photoshop Training Intro

Course

Acrobat Forms

Course

Anger Management & Negotiation Skills

Course

Copilot for M365 Live Online

Course

Power BI Advanced

Course

Copilot for Excel

Course

AI Prompting Fundamentals

Course

Microsoft 365 Intermediate

Course

Excel Advanced

Course

Excel VBA

Course

Project Advanced

Course

R Programming Advanced

Course

Python Advanced

Course

Power Apps Intermediate | Power Automate + Power BI Integration

Course

SharePoint Advanced (Site Owner)

Course

InDesign Training Advanced

Course

Assertiveness & Confidence

Course

Microsoft Access Advanced

Course

Power BI DAX

Course

Copilot for PowerPoint

Course

Excel Expert

Course

Machine Learning in R

Course

Power Apps Advanced

Course

SharePoint Advanced (Document Governance)

Course

Building Resilience

Course

Copilot for Outlook and Teams

Course

Coaching and Mentoring

Course

Illustrator Training Advanced

Course

Premiere Basics Training

Course

Advanced After Effects Training

Course

Canva Beginners

Course

WordPress Essentials

Course

Communications

Course

Microsoft Copilot Studio Building AI Agents

Course

AI for Business Leaders and Managers

Course

Photoshop Training Advanced

Course

Advanced Premiere Training

Course

Canva Intermediate

Course

Communications & Quality Client Service Training

Course

Power BI Copilot Training

Course

InDesign Interactivity Training

Course

Canva Advanced

Course

Critical Thinking and Problem Solving

Course

M365 Copilot for Customer Service

Course

AI Governance Training

Course

InDesign Accessibility Training

Course

Cultural Diversity in the Workplace

Course

M365 Copilot for Sales

Course

Microsoft Outlook Advanced

Course

Embracing Change

Course

SQL Advanced

Course

Growing Emotional Intelligence

Course

M365 Copilot for Operations

Course

Planner Premium

Course

Minute Taking

Course

M365 Copilot for Marketing

Course

Excel Tables and Pivot Tables

Course

Power Automate Beginner

Course

Performance Management

Course

Data Transformation with Power Query

Course

M365 Copilot for Legal Services

Course

Excel Macro Mastery

Course

Power Automate Intermediate

Course

Persuasion and Negotiation Skills

Course

Power BI Desktop Advanced Reporting

Course

M365 Copilot for HR

Course

Presentation Skills and Public Speaking

Course

Data Visualisation with Power BI Desktop

Course

M365 Copilot for Finance

Course

Practical Project Management

Course

Copilot M365 for Executives and Managers

Course

Respect, Equity and Diversity (RED)

Course

Resumé Writing and Interview Skills

Course

Stress Management

Course

Team Leadership, Management and Development

Course

Time Management Intensive

Course

Train the Trainer

Course

Write Effective Business Documents

Course

Dealing with Difficult People

Course

Managing Difficult Conversations

Course

Managing the Virtual Workplace

Course

Customer Service Training

Course

Technical Writing

Build complete Power BI reports from data to visualisation.

Nexacu’s Data Visualisation with Power BI Desktop course helps professionals create end-to-end Power BI reports, from importing and transforming data through to building interactive visuals and publishing reports.

This instructor-led course covers Power Query transformations, data models, table relationships, DAX measures and calculated columns, slicers, maps, drill-through pages, bookmarks, buttons, custom visuals and the Power BI Service.

Quick Answer

Data Visualisation with Power BI Desktop is a one-day course for professionals who want to build complete Power BI reports and dashboards. The course covers importing and transforming data, modelling relationships, creating DAX measures and columns, building interactive visuals, using filters and drill-through pages, and publishing reports in the Power BI Service. Excel data skills are recommended.

Who should attend?

Analysts, managers, Excel users, reporting teams, finance teams, operations teams and anyone responsible for creating Power BI reports, dashboards or visualisations.

What will you learn?

Learn how to connect to data, transform it in Power Query, model relationships, create DAX measures, build report visuals, apply filters and publish reports.

Prerequisite: Comfort with Excel features such as Tables, PivotTables, sorting, filtering and charts is recommended. Completion of Excel Intermediate and PivotTable courses is advantageous.

This course can also be taken as part of the PL-300 Power BI Certification pathway.

Course Details

Download Course PDF
Price
$622
Duration
1 day
Times
9am - 4.30pm (approx)
Class Size (max)
8
Class Size (avg)
6
Reference Materials
Provided
CPD Hours
6 hours
Delivery
Instructor-led training
Live Online

Course Details

Download Course PDF
Price
$622
Duration
1 day
Time
9am - 4.30pm (approx)
Class Size (max)
8
Class Size (avg)
6
Reference Materials
Provided
Training Computer
Provided
CPD Hours
6 hours
Delivery
Instructor-led training
Address
Level 8
201 Charlotte Street
Brisbane QLD 4000

Course Details

Download Course PDF
Price
$622
Duration
1 day
Time
9am - 4.30pm (approx)
Class Size (max)
8
Class Size (avg)
6
Reference Materials
Provided
Training Computer
Provided
CPD Hours
6 hours
Delivery
Instructor-led training
Address
Level 24/477 Pitt Street
Sydney
New South Wales 2000

Course Details

Download Course PDF
Price
$622
Duration
1 day
Time
9am - 4.30pm (approx)
Class Size (max)
8
Class Size (avg)
6
Reference Materials
Provided
Training Computer
Provided
CPD Hours
6 hours
Delivery
Instructor-led training
Address
Level 12A
45 William Street Melbourne VIC 3000

Course Details

Download Course PDF
Price
$622
Duration
1 day
Time
9am - 4.30pm (approx)
Class Size (max)
8
Class Size (avg)
6
Reference Materials
Provided
Training Computer
Provided
CPD Hours
6 hours
Delivery
Instructor-led training
Address
NEW LOCATION
Level 2
221 London Circuit
Canberra ACT 2600

Course Details

Download Course PDF
Price
$622
Duration
1 day
Time
9am - 4.30pm (approx)
Class Size (max)
8
Class Size (avg)
6
Reference Materials
Provided
Training Computer
Provided
CPD Hours
6 hours
Delivery
Instructor-led training
Address
Level 15
33 King William Street
Adelaide 5000

Course Details

Download Course PDF
Price
$622
Duration
1 day
Time
9am - 4.30pm (approx)
Class Size (max)
8
Class Size (avg)
6
Reference Materials
Provided
Training Computer
Provided
CPD Hours
6 hours
Delivery
Instructor-led training
Address
Level 7
553 Hay Street
Perth WA 6000

Course Details

Download Course PDF
Price
$622
Duration
1 day
Times
9am - 4.30pm (approx)
Class Size (max)
8
Class Size (avg)
6
Reference Materials
Provided
CPD Hours
6 hours
Delivery
Instructor-led training
Live Online

Upcoming Courses

Remote East

Brisbane

Sydney

Melbourne

Canberra

Adelaide

Perth

Remote West

Remote East
Date
Course
City
Status
Wed 17 Jun 26
Wed
17
Jun
Data Visualisation with Power BI Desktop
Remote East
Status: Scheduled
Scheduled
Thu 25 Jun 26
Thu
25
Jun
Data Visualisation with Power BI Desktop
Remote East
Status: Scheduled
Scheduled
Wed 15 Jul 26
Wed
15
Jul
Data Visualisation with Power BI Desktop
Remote East
Status: Scheduled
Scheduled
Brisbane
Date
Course
City
Status
Thu 25 Jun 26
Thu
25
Jun
Data Visualisation with Power BI Desktop
Brisbane
Status: Scheduled
Scheduled
Sydney
Date
Course
City
Status
Wed 17 Jun 26
Wed
17
Jun
Data Visualisation with Power BI Desktop
Sydney
Status: Scheduled
Scheduled
Wed 15 Jul 26
Wed
15
Jul
Data Visualisation with Power BI Desktop
Sydney
Status: Scheduled
Scheduled
Melbourne

We currently have no public courses scheduled. Please contact us to register your interest.

Canberra

We currently have no public courses scheduled. Please contact us to register your interest.

Adelaide
Date
Course
City
Status
Wed 15 Jul 26
Wed
15
Jul
Data Visualisation with Power BI Desktop
Adelaide
Status: Scheduled
Scheduled
Perth

We currently have no public courses scheduled. Please contact us to register your interest.

Remote West

We currently have no public courses scheduled. Please contact us to register your interest.

Scheduled
Taking enrollments.
Confirmed
Taking enrollments.
Few Seats left
Book Now.
Sold Out
Try another date.

Power BI Training Courses

Course Icon Power BI Beginner

Learn to use Power BI to create interactive dashboards, custom reports, analyse data and share insights.

download course pdf
Price: $395
Course Icon Power BI Intermediate

Learn to build data models and calculations to produce intelligent dashboards. In-class and remote training.

download course pdf
Price: $595
Course Icon Power BI Advanced

Advance your Power BI skills by learning DAX; Row Context, Functions, Calculated Columns, Measures and more.

download course pdf
Price: $595
Course Icon Power BI DAX

Learn Power BI DAX from our experienced trainers. Login remotely or attend our CBD locations nationwide.

download course pdf
Price: $595
Course Icon Power BI Desktop Advanced Reporting

Master advanced Power BI reporting techniques in 1 day. Learn to create complex, layered, and interactive reports with custom visuals and navigation controls.

download course pdf
Price: $622
Course Icon Power BI Data Transformation using Power Query

Learn Power Query for Excel and Power BI Desktop in 1 day. Master data transformation, query management, and M code to optimise your data workflows.

download course pdf
Price: $622
PL-300 Power BI Certification

Become a Microsoft Power BI certified expert. Attend our Nexacu Power BI courses, sit the PL-300 exam and become a Power BI Data Analyst Associate.

Price: 

$2,170 inc GST

Data Visualisation with Power BI Desktop Course Content

Expand All | Collapse All

Introduction to Power BI

Acquiring data using Power Query

Overview of the Power BI ecosystem and history

Setting up Power BI accounts and navigating the interface

Exploring the Power BI visual marketplace

The Report Generation Process

Understanding and managing data types in Power BI

Establishing and managing relationships between tables

Creating and using measures and calculated columns

Introduction to simple M and DAX formulas

Basic Visualisation Concepts

Working with slicers, filters, and timelines

Understanding and applying different visualisation types

Data Categories and Map Visualisations

Using different types of map visuals effectively

Resolving common issues with geolocation data

Using Visualisations in Reports

Creating and customising charts, cards, tables, and objects

Incorporating slicers to enhance report interactivity

Reports: Styling and Sharing

Styling and formatting reports for a professional look

Publishing and sharing dashboards and reports with stakeholders

Frequently Asked Questions

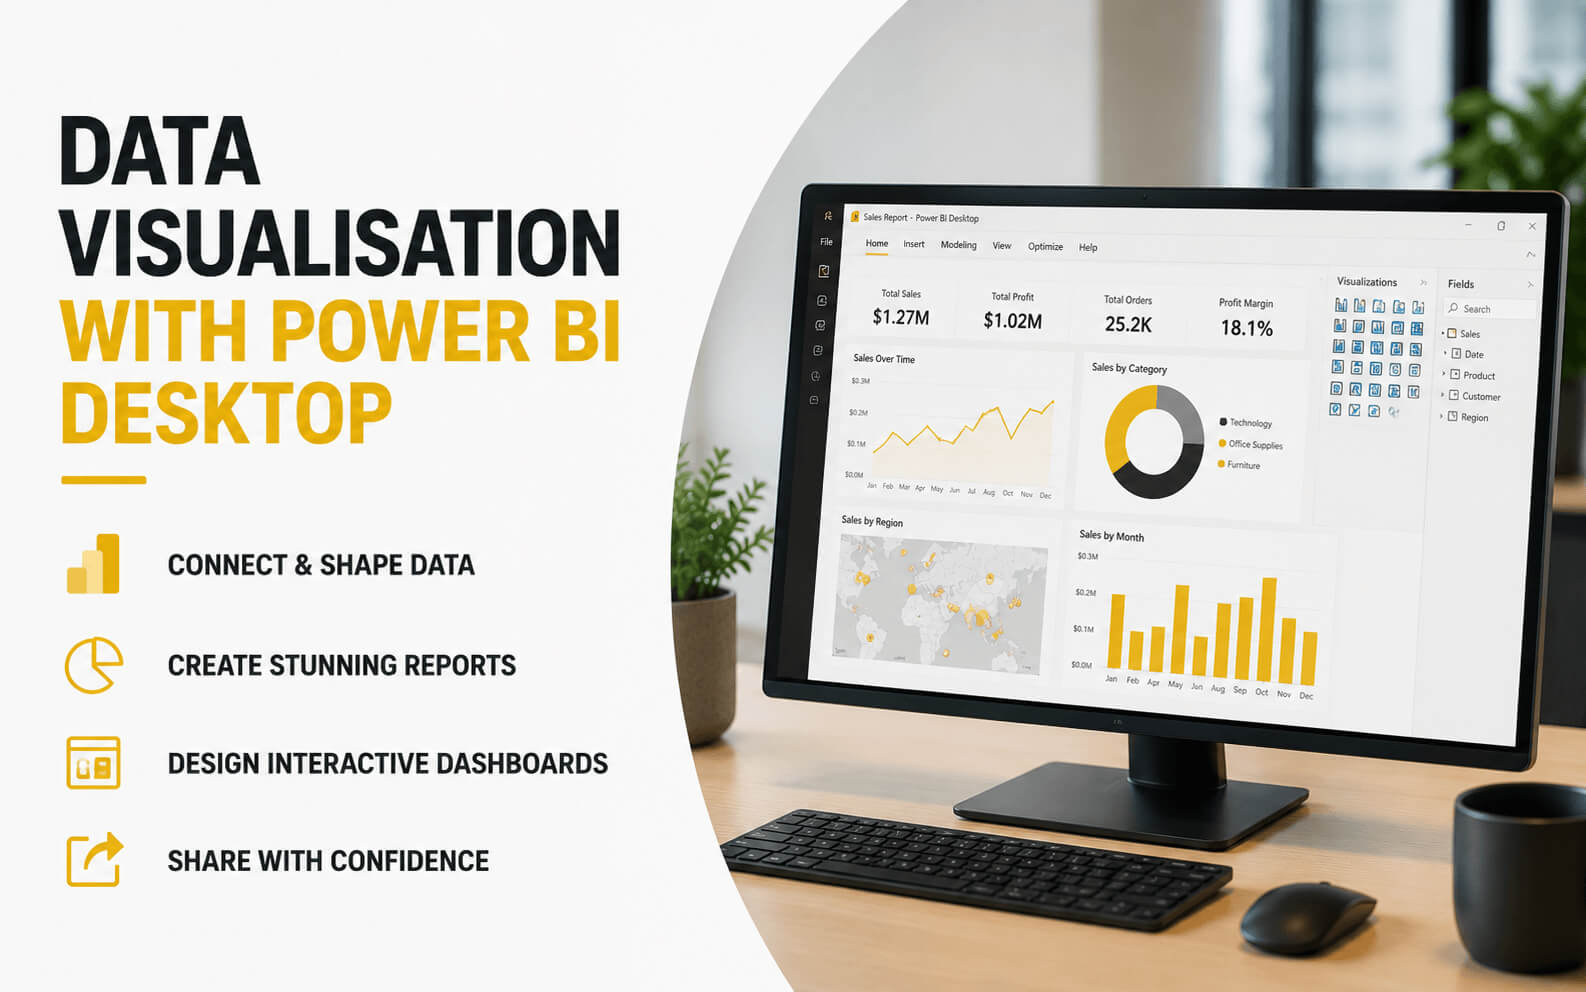
What is data visualisation in Power BI?

Data visualisation in Power BI is the process of turning data into interactive reports, charts, dashboards and visuals that help users understand trends, compare results and communicate insights clearly.

What will I learn in the Data Visualisation with Power BI Desktop course?

You will learn how to import data, transform and shape data in Power Query, create data models, manage relationships, build DAX measures and calculated columns, create interactive visuals, apply filters, use drill-through pages and publish reports through the Power BI Service.

Who should attend this Power BI data visualisation course?

This course is suitable for analysts, managers, Excel users, reporting teams, finance teams, operations teams and anyone who needs to create Power BI reports, dashboards or visualisations from business data.

Do I need Power BI experience before attending?

No prior Power BI experience is required, but comfort working with data in Excel is recommended. Experience with Excel Tables, PivotTables, sorting, filtering and charts will help participants get more from the course.

Does this course cover Power Query?

Yes. The course covers Power Query transformations such as renaming, removing and splitting columns, merging queries, replacing and filling values, and setting data types.

Does this course cover DAX?

Yes. Participants learn core DAX measures such as SUM, AVERAGE, SUMX and AVERAGEX, as well as calculated columns for grouping, filtering and mapping.

Will I learn how to build interactive Power BI reports?

Yes. The course covers interactive report features including matrix visuals, charts, slicers, cards, maps, visual filters, page filters, report-level filters, Top N filtering, drill-through pages, bookmarks and action buttons.

Does this course cover Power BI dashboards?

The course focuses on building Power BI reports and interactive visuals in Power BI Desktop, then publishing and sharing reports through the Power BI Service. These skills provide the foundation for creating useful dashboards and report experiences.

Can I take this Power BI course online?

Yes. Nexacu offers this course as instructor-led live online training, with face-to-face options also available where scheduled. Remote participants can ask questions, complete exercises and receive trainer support during the session.

What is remote Power BI training?

Remote Power BI training is delivered live online by an instructor. Participants attend via video conferencing, ask questions, join discussions, complete exercises and interact with the trainer throughout the course.

Is Data Visualisation with Power BI Desktop part of the PL-300 certification pathway?

Yes. This course can be taken as part of Nexacu’s PL-300 Power BI Certification pathway for learners who want to build a broader Power BI skill set.

What Power BI course should I take after this course?

After Data Visualisation with Power BI Desktop, many learners progress to Power BI Intermediate, Power BI Advanced, Power BI DAX, Data Transformation with Power Query or PL-300 Power BI Certification, depending on their role and goals.

Will I receive a certificate after completing this course?

Yes. Participants receive a certificate of completion, which can be added to a resumé or LinkedIn profile to acknowledge their Power BI training.

Ready to build better Power BI reports?

Choose an upcoming Data Visualisation with Power BI Desktop course date and learn how to create interactive reports, visuals and data models in Power BI.

View Course Dates Enquire About Team Training

Course Details

Download Course PDF
Price
$622
Duration
1 day
Times
9am - 4.30pm (approx)
Class Size (max)
8
Class Size (avg)
6
Reference Materials
Provided
CPD Hours
6 hours
Delivery
Instructor-led training
Live Online

Course Details

Download Course PDF
Price
$622
Duration
1 day
Time
9am - 4.30pm (approx)
Class Size (max)
8
Class Size (avg)
6
Reference Materials
Provided
Training Computer
Provided
CPD Hours
6 hours
Delivery
Instructor-led training
Address
Level 8
201 Charlotte Street
Brisbane QLD 4000

Course Details

Download Course PDF
Price
$622
Duration
1 day
Time
9am - 4.30pm (approx)
Class Size (max)
8
Class Size (avg)
6
Reference Materials
Provided
Training Computer
Provided
CPD Hours
6 hours
Delivery
Instructor-led training
Address
Level 24/477 Pitt Street
Sydney
New South Wales 2000

Course Details

Download Course PDF
Price
$622
Duration
1 day
Time
9am - 4.30pm (approx)
Class Size (max)
8
Class Size (avg)
6
Reference Materials
Provided
Training Computer
Provided
CPD Hours
6 hours
Delivery
Instructor-led training
Address
Level 12A
45 William Street Melbourne VIC 3000

Course Details

Download Course PDF
Price
$622
Duration
1 day
Time
9am - 4.30pm (approx)
Class Size (max)
8
Class Size (avg)
6
Reference Materials
Provided
Training Computer
Provided
CPD Hours
6 hours
Delivery
Instructor-led training
Address
NEW LOCATION
Level 2
221 London Circuit
Canberra ACT 2600

Course Details

Download Course PDF
Price
$622
Duration
1 day
Time
9am - 4.30pm (approx)
Class Size (max)
8
Class Size (avg)
6
Reference Materials
Provided
Training Computer
Provided
CPD Hours
6 hours
Delivery
Instructor-led training
Address
Level 15
33 King William Street
Adelaide 5000

Course Details

Download Course PDF
Price
$622
Duration
1 day
Time
9am - 4.30pm (approx)
Class Size (max)
8
Class Size (avg)
6
Reference Materials
Provided
Training Computer
Provided
CPD Hours
6 hours
Delivery
Instructor-led training
Address
Level 7
553 Hay Street
Perth WA 6000

Course Details

Download Course PDF
Price
$622
Duration
1 day
Times
9am - 4.30pm (approx)
Class Size (max)
8
Class Size (avg)
6
Reference Materials
Provided
CPD Hours
6 hours
Delivery
Instructor-led training
Live Online

skills test nexacu

Skills Test

Try our short skills test and find out which course is right for you.

Skills Test

Locations In-Person & Online

Find the nearest location and date that works for you

Locations In-Person & Online

Find the nearest location and date that works for you

Related Training Courses

Course Icon Power BI Beginner

Learn to use Power BI to create interactive dashboards, custom reports, analyse data and share insights.

download course pdf
Price: $395
Course Icon Power BI Intermediate

Learn to build data models and calculations to produce intelligent dashboards. In-class and remote training.

download course pdf
Price: $595
Course Icon Power BI Advanced

Advance your Power BI skills by learning DAX; Row Context, Functions, Calculated Columns, Measures and more.

download course pdf
Price: $595
Course Icon Power BI DAX

Learn Power BI DAX from our experienced trainers. Login remotely or attend our CBD locations nationwide.

download course pdf
Price: $595
Course Icon Power BI Desktop Advanced Reporting

Master advanced Power BI reporting techniques in 1 day. Learn to create complex, layered, and interactive reports with custom visuals and navigation controls.

download course pdf
Price: $622
Course Icon Power BI Data Transformation using Power Query

Learn Power Query for Excel and Power BI Desktop in 1 day. Master data transformation, query management, and M code to optimise your data workflows.

download course pdf
Price: $622
PL-300 Power BI Certification

Become a Microsoft Power BI certified expert. Attend our Nexacu Power BI courses, sit the PL-300 exam and become a Power BI Data Analyst Associate.

Price: 

$2,170 inc GST

Locations In-Person & Online

Find the nearest location and date that works for you

Locations In-Person & Online

Find the nearest location and date that works for you

Trusted Nationwide by Leading Organisations

at Nexacu, we're proud to be the trusted training partner for hundreds of leading organisations accross Australia and New Zealand. From government departments to top corporates, we help teams upskill and succeed everyday

  • 400+ companies rely on Nexacu for team training
  • Trusted by federal, state, and local government agencies
  • Delivering training across 9 countries

Why Nexacu?

Books Icon

Step by Step Courseware

Custom workbook included with a step by step exercises

Facility Image 2
Facility Image 3
Facility Image 1

Refresh Icon

Free Refresher

Resit your course for free within 6 Months

More than 1,300 Business trust Nexacu

Trusted by Business

Procured by Government

Procured by Goverment

Reviews Not Found

Valued by Individuals